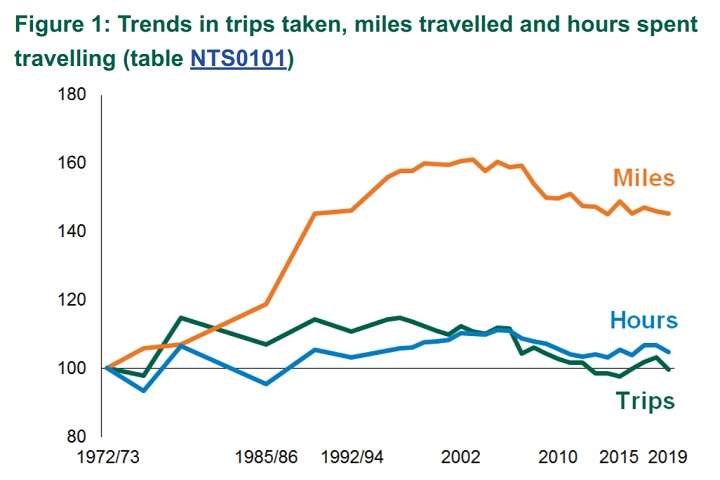
An annual Government survey shows people made fewer journeys by foot in 2019 – with a similar decline in the overall number of trips made per person.
The National Travel Survey (NTS) is a household survey carried out by the DfT to monitor long-term trends in personal travel and to inform the development of policy.
The survey collects information on how, why, when and where people travel as well as factors affecting travel – such as car availability and driving licences.
The latest survey, published on 5 August, shows the average number of trips made per person in 2019 was 953 – down 3% from 986 in 2018 and the lowest figure since 2015 (934).
The average number of walking trips (of less than one mile) fell by 5% from 262 to 250 in 2019 – while journeys by car/van drivers also dropped, down 4% to 380.
The 2019 NTS shows no real change in terms of percentage of trips, as the car continues to dominate. 61% of journeys in 2019 were made as either a driver or passenger – the same level as 2018 and 2017.
A total of 26% of journeys were made by foot – compared to 27% in 2017- while the percentage of cycling trips remained at 2% for the fourth consecutive year.
Looking at distance travelled, cars accounted for 77% – followed by train (10%) and bus (4%). Walking accounted for 3%, and cycling 1%.
75% of people (aged 17 years and above) held a driving licence in 2019 – equating to 32.7 million.
Comment on this story