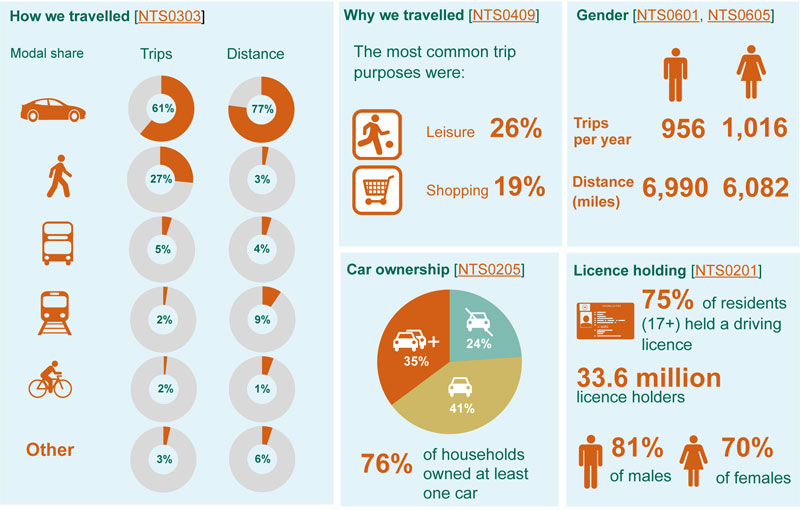
An annual Government survey show no real change in the modes of transport people are using – although the number of trips made by foot rose by 1% for the second consecutive year.
The annual National Travel Survey is a household survey carried out by the DfT to monitor long-term trends in personal travel and to inform the development of policy.
The survey collects information on how, why, when and where people travel as well as factors affecting travel – such as car availability and driving licences.
The latest survey, published on 31 July, shows 27% of journeys were made by foot in 2018 – compared to 26% in 2017 and 25% in 2016.
Continuing with active travel, the percentage of cycling trips remained at 2% for the third consecutive year.
However, the car continues to dominate, with 61% of journeys made as either a driver or passenger – the same level as 2017.
In terms of distance travelled, cars accounted for 77% – followed by train (9%) and bus (4%). Walking accounted for 4%, and cycling 1%.
Overall, the average number of trips made per person in 2018 was 968 – the highest since 2009.
75% of people (aged 17 years and above) held a driving licence in 2018 – equating to 33.6 million.
If cycling has not increased over three year it appears to me that all these grandiose expensive cycling schemes that have been imposed on us by trendy councils have had no benefit whatsoever. I suggest that no more cycling schemes be allowed and that the London cycling highways be opened to all traffic.
Robert Bolt, Saint Albans
--2
Ok have the factors changed I don’t think so?
Here’s my take:
Trains: Very Expensive, unreliable and overcrowded
Cars: affordable compared to the trains reliable and not time constricted and you can carry loads of stuff not up and down steps!
Busses on a whole disappointing as in London they are very good.
Bicycles: We are doing a lot well but not everything well in terms of perception of safety?
That’s me finished.
Gareth, London
+4