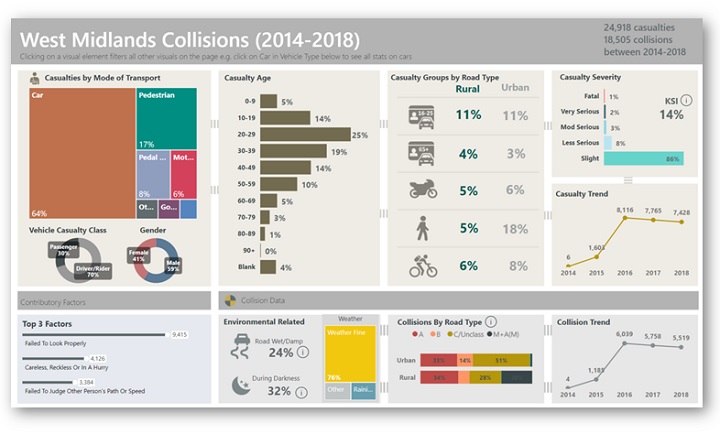
Local authorities are being invited to test a new statistics dashboard, before it is officially made available by the Department for Transport.
The Power BI CRaSH data dashboard has been created to provide road safety analysts, managers and practitioners with access to casualty data to inform their work.
The dashboard shows statistics on various data points, including demographics on age, injury severity, contributory factors, road type, time and day, driver/riders involved and most recorded postcodes.
The dashboard also includes a collision map pin pointing collision locations, with the option to show a heatmap.
Ahead of its launch, local authorities are being invited to test the dashboard, and provide feedback in the form of a short survey.
Those interested in taking part will need to:
- Be from a local authority who is part of a CRaSH police force
- Have a Microsoft Power BI *Pro* licence
- Have a .gov email address
Click here to register to participate.
Confucius is alleged to have said that the the beginning of wisdom is to call things by their proper name. That sounds sensible to me, and so I cannot understand why this sample is headed West Midlands Collisions. Surely, in this age of inclusion it ought to read “West Midlands Road Traffic Accidents”, if only because that it is to those phenomena that the legislation refers. (RTC = road traffic casualties in the legislation. Why confuse things in their way?)
It might also be wiser to consider the taxonomy. STATS19, although not perfect, addresses Accident Circumstances, Vehicles, and Casualties in that order, which is surely logical. Would it not be sensible for the “dashboard” to follow suit? Instead we have an erroneous heading “collisions”, followed by data which mainly relates to casualties.
Furthermore, we have a sub-heading which refers to Vehicle Type, but no there’s such reference below.
We also have “contributory factors” – probably the most useless of the data collected – given excess credence by their continued appearance in official data. It would be good to see more, but as I’m excluded, I can only see this as a summary which might be presented to Members, to satisfy their curiosity. It could be a great time-saver, perhaps, but its usefulness to bona fide accident investigation units is questionable. Road accident trend between 2014 and 2016 is alarming, though.
Verdict on what I can see: potentially pretty presentational vehicle, not clear wha contribution it might make to accident reduction.
Fraser, Andrew, STIRLING
0