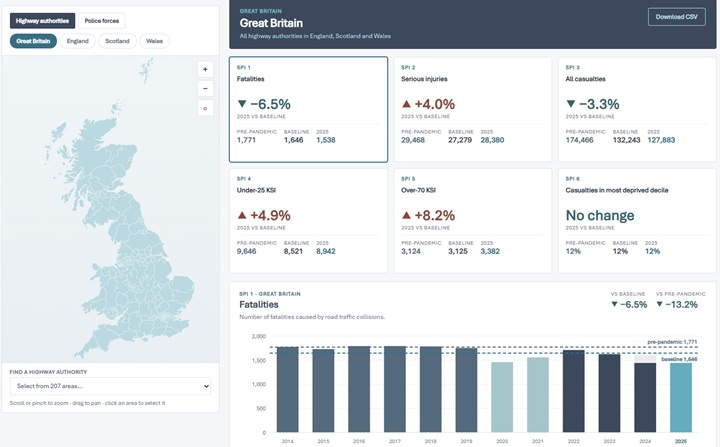
Agilysis has launched a free interactive dashboard that enables highway authorities and police forces across Great Britain to measure their performance against the Department for Transport’s new Road Safety Strategy for the first time.
Released just two weeks after publication of the 2025 Reported Road Casualties Great Britain (RRCGB) STATS19 data, the online dashboard provides the first local view of six Safety Performance Indicators (SPIs) measured against the government’s new 65% casualty reduction target.
The free tool covers Great Britain, England, Scotland and Wales, as well as all 207 highway authorities and 43 police force areas, giving road safety practitioners immediate access to consistent, comparable performance data.
Rather than presenting a single annual figure, each indicator is shown alongside three reference points: the 2014–2019 pre-pandemic average, the Department for Transport’s official 2022–2024 baseline, and the latest 2025 data. Agilysis says this provides the context needed to interpret local performance more meaningfully.
The dashboard has been built using the confirmed 2025 local authority boundaries, despite many councils currently progressing through Local Government Reorganisation (LGR). This means authorities undergoing structural change can still assess their current performance, while future updates will incorporate newly formed unitary authorities once boundaries are confirmed.
Agilysis also plans to expand the dashboard as the remaining 11 national SPIs become available. Several additional indicators, including the proportion of traffic travelling within the speed limit, are already in development and await data-sharing approval. Statistical significance testing will also be introduced in a future release to help distinguish genuine changes in safety performance from normal year-to-year variation.
Richard Owen, chief executive officer at Agilysis, said: “This is the first year we can actually measure locally against the targets in the new strategy, so it’s important that we get an accurate measure. The only complication is Local Government Reorganisation, but once that is settled, we’ll include new authorities in an update later this year.
“We built this dashboard to make data more accessible to those who run our road networks, making it free and available in one place, rather than leaving it buried in a national spreadsheet.”
Tanya Fosdick, chief operating officer at Agilysis, added: “A single year of casualty data, especially for smaller counts, will always move around more than the underlying safety of the network. We’ve built the dashboard to show every indicator against the longer pre-pandemic average as well as the baseline, so users can see that context rather than reading one number in isolation.
“We’d genuinely welcome authorities and police forces telling us what would make it more useful to them.”
Agilysis has also published a companion white paper, Measuring risk before it becomes harm, exploring the role of Safety Performance Indicators in supporting the new Road Safety Strategy.
Perhaps its more useful to allocate responsibility rather than blame. “Blame” may well be good for assessing individual acts, but “responsibility” goes beyond that to look at the bigger picture of how the road rules, social norms and enforcement conditions the way that people interact in motors, cycles and on foot.
A Safe System looks to mitigate each of the elements that can contribute to a collision and casualty. It needs to look at these elements individually and collectively.
Rod King, Lymm
0
Andrew: Aside from Acts of God and unforseen medical episodes perhaps, I don’t see how one (or more) road users (as applicable) cannot be held responsible for their road traffic accidents? If we don’t allocate blame, how are we to learn and improve?
Hugh Jones, South Wirral
+1
Just another distraction? Usual mistake – comparing an average with another entity, a single figure. Will we never learn to comapre like with like? Tend to agree with Neil and Hugh, the latter up to a point. Road users are not always to blame for road traffic accidents. Time we remembered Leeming’s work … allocating personal blame is largely a waste of time.
Andrew Fraser, STIRLING
0
In this day and age it’s unfortunate that the data is presented, acknowledging that it’s based on Stats19 data, using Local Authority boundaries, rather than responsible Highway Authority. In Bucks we have a number of NH routes in and through County which do contribute to the overall figures. And although we support NH where we can through amplification of campaigns and support for NH roadside events, etc often the road safety factors contributing to incidents on the NH network are beyond our scope, influence and/or jurisdiction.
Neil O’Leary, Buckinghamshire
0
Whilst probably well-intentioned, I can’t help thinking that measuring the ‘performance’ of highway authorities and police etc. seems a bit unfair, as if they are solely to blame for road casualties. Road users are to blame for road casualties – the authorities do what they can, but at the end of the day, they can’t control the individual actions of the reckless and careless. It would be like measuring the ‘performance’ of the NHS, solely by how well the general public are, ignoring lifestyle choices and individuals taking responsibility for their own well-being.
Hugh Jones, South Wirral
--1